1) Download and Install VS Code from https://code.visualstudio.com/download.
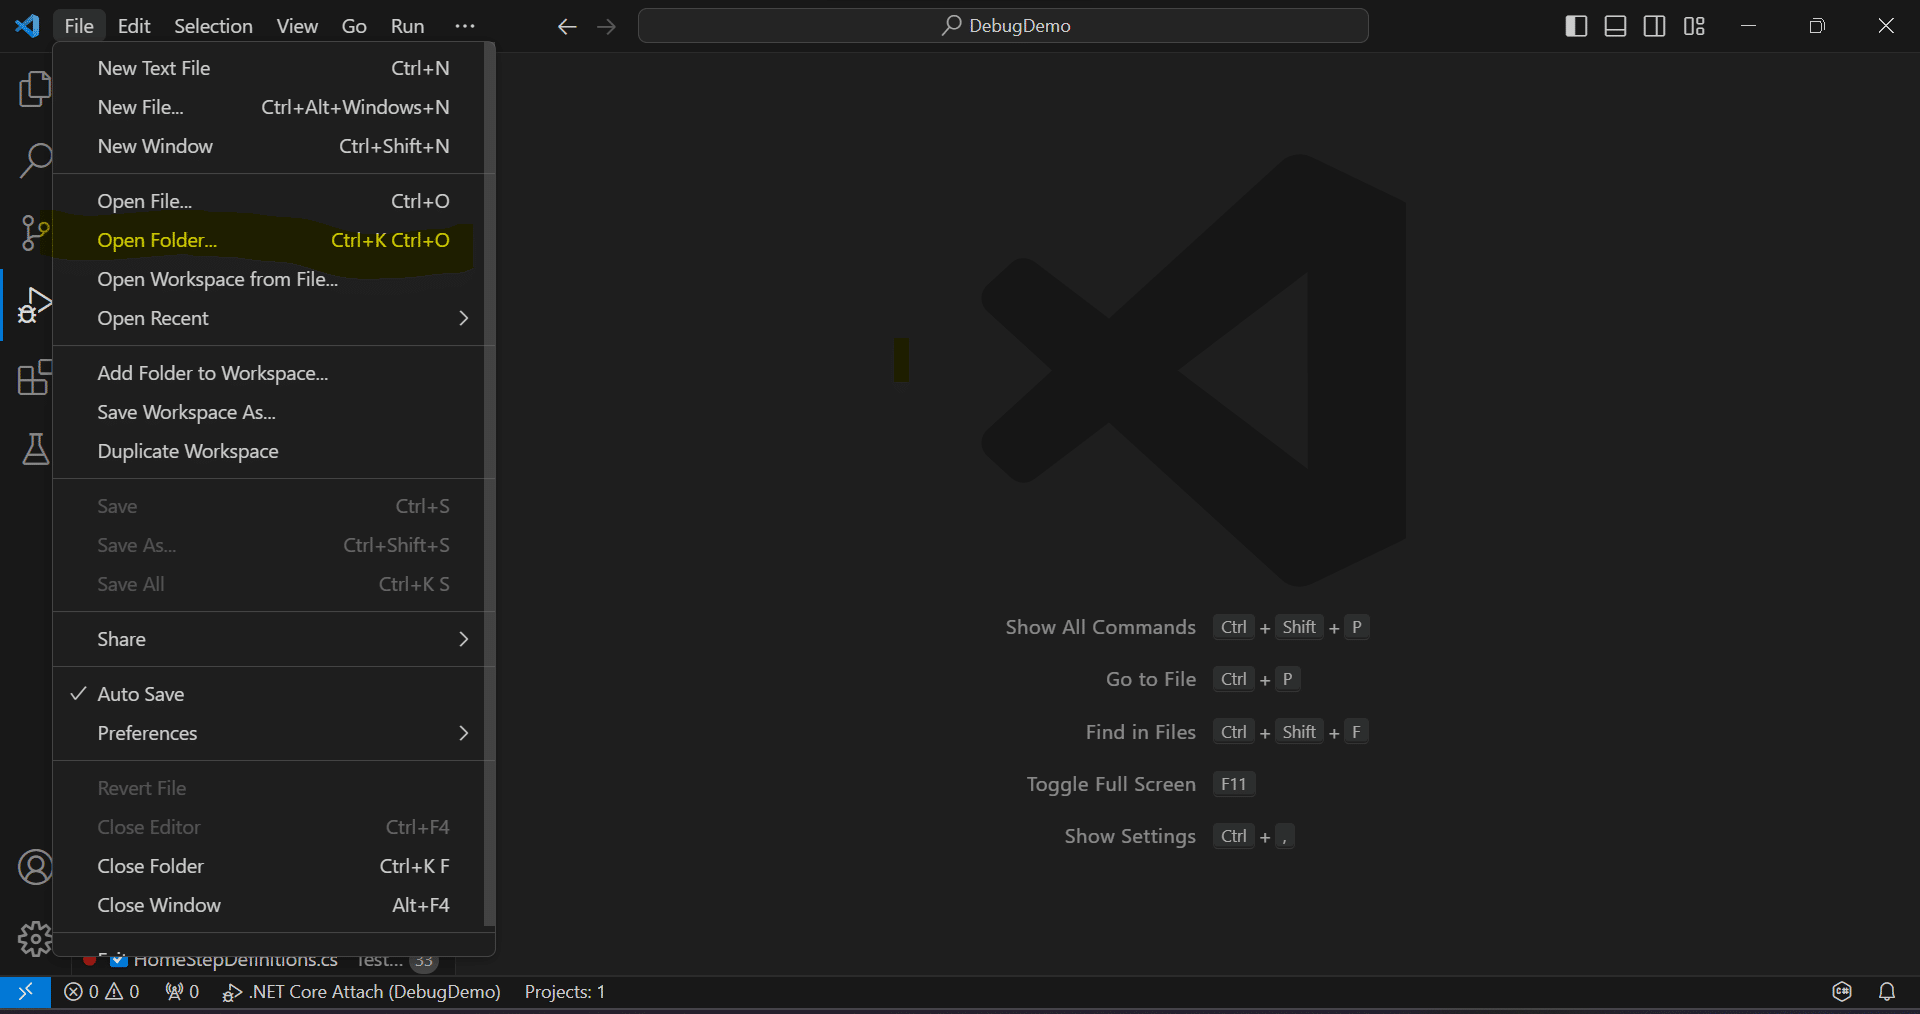
2) Select the Open folder Option from the VS Code File Menu and choose your project folder.
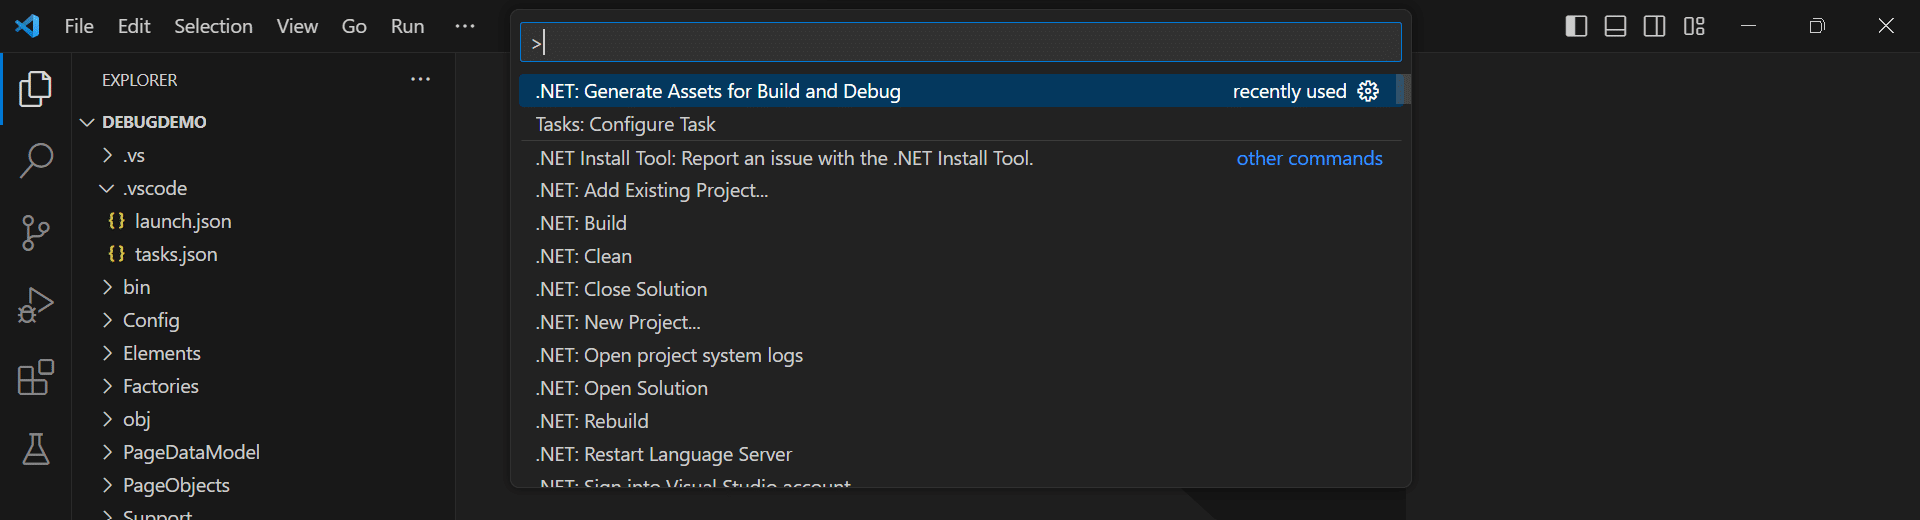
3) Search and select option .NET: Generate Assets for Build and Debug. This will create a .vscode folder in your workspace and will create launch.json and tasks.json.
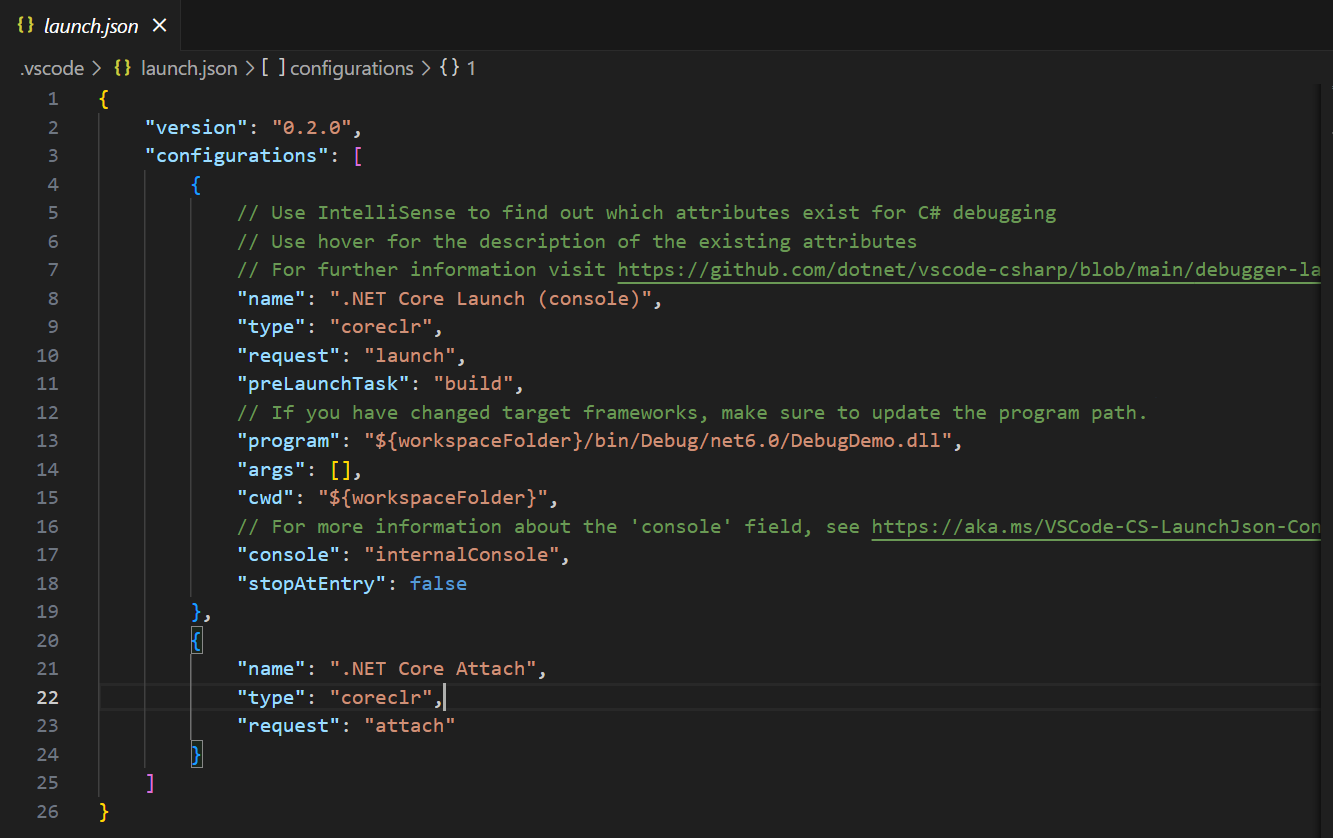
4) launch.json should look like this. Here DebugDemo.dll is the project name which you can replace with your project name.
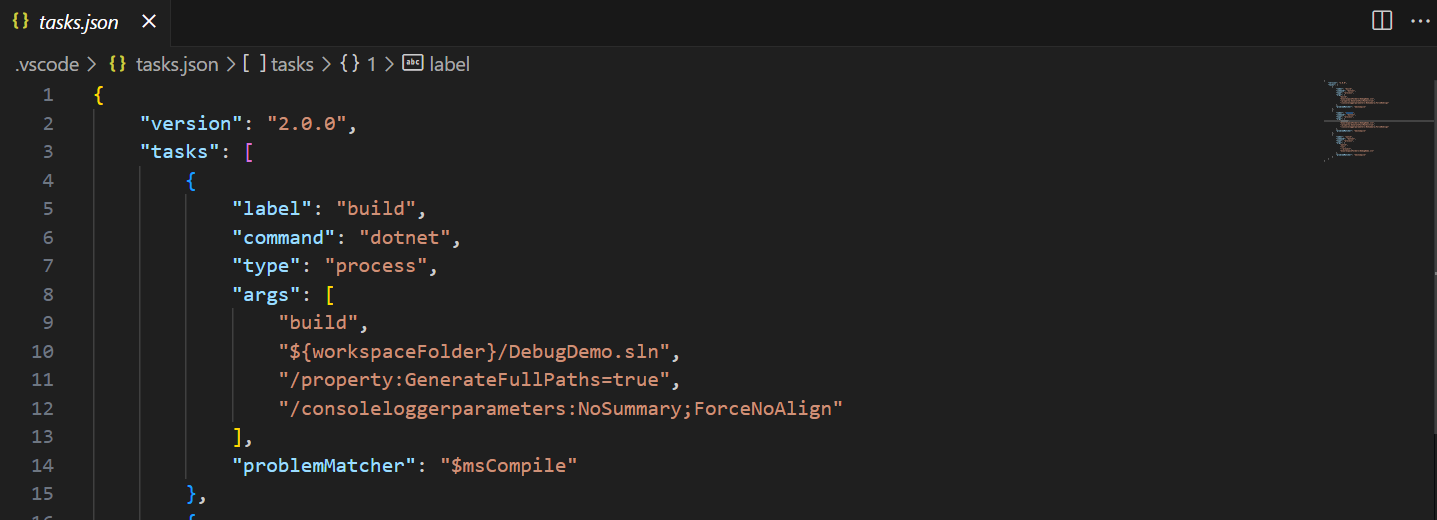
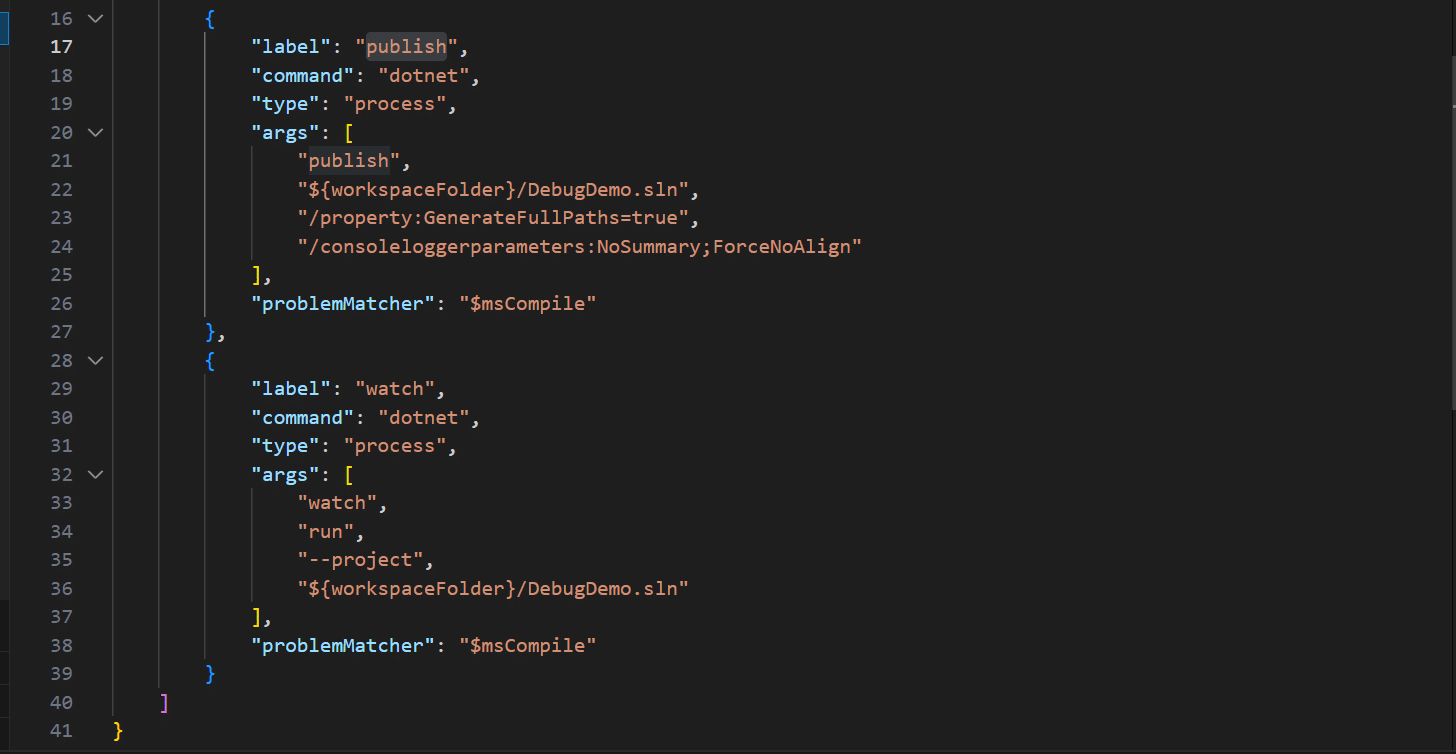
5) tasks.json should look like this, similarly DebugDemo.sln should be replaced with your project solution name.
6) Move to run and debug (Ctrl + Shift + D). You should see two options .NET Core Launch (console) and .NET Core Attach.
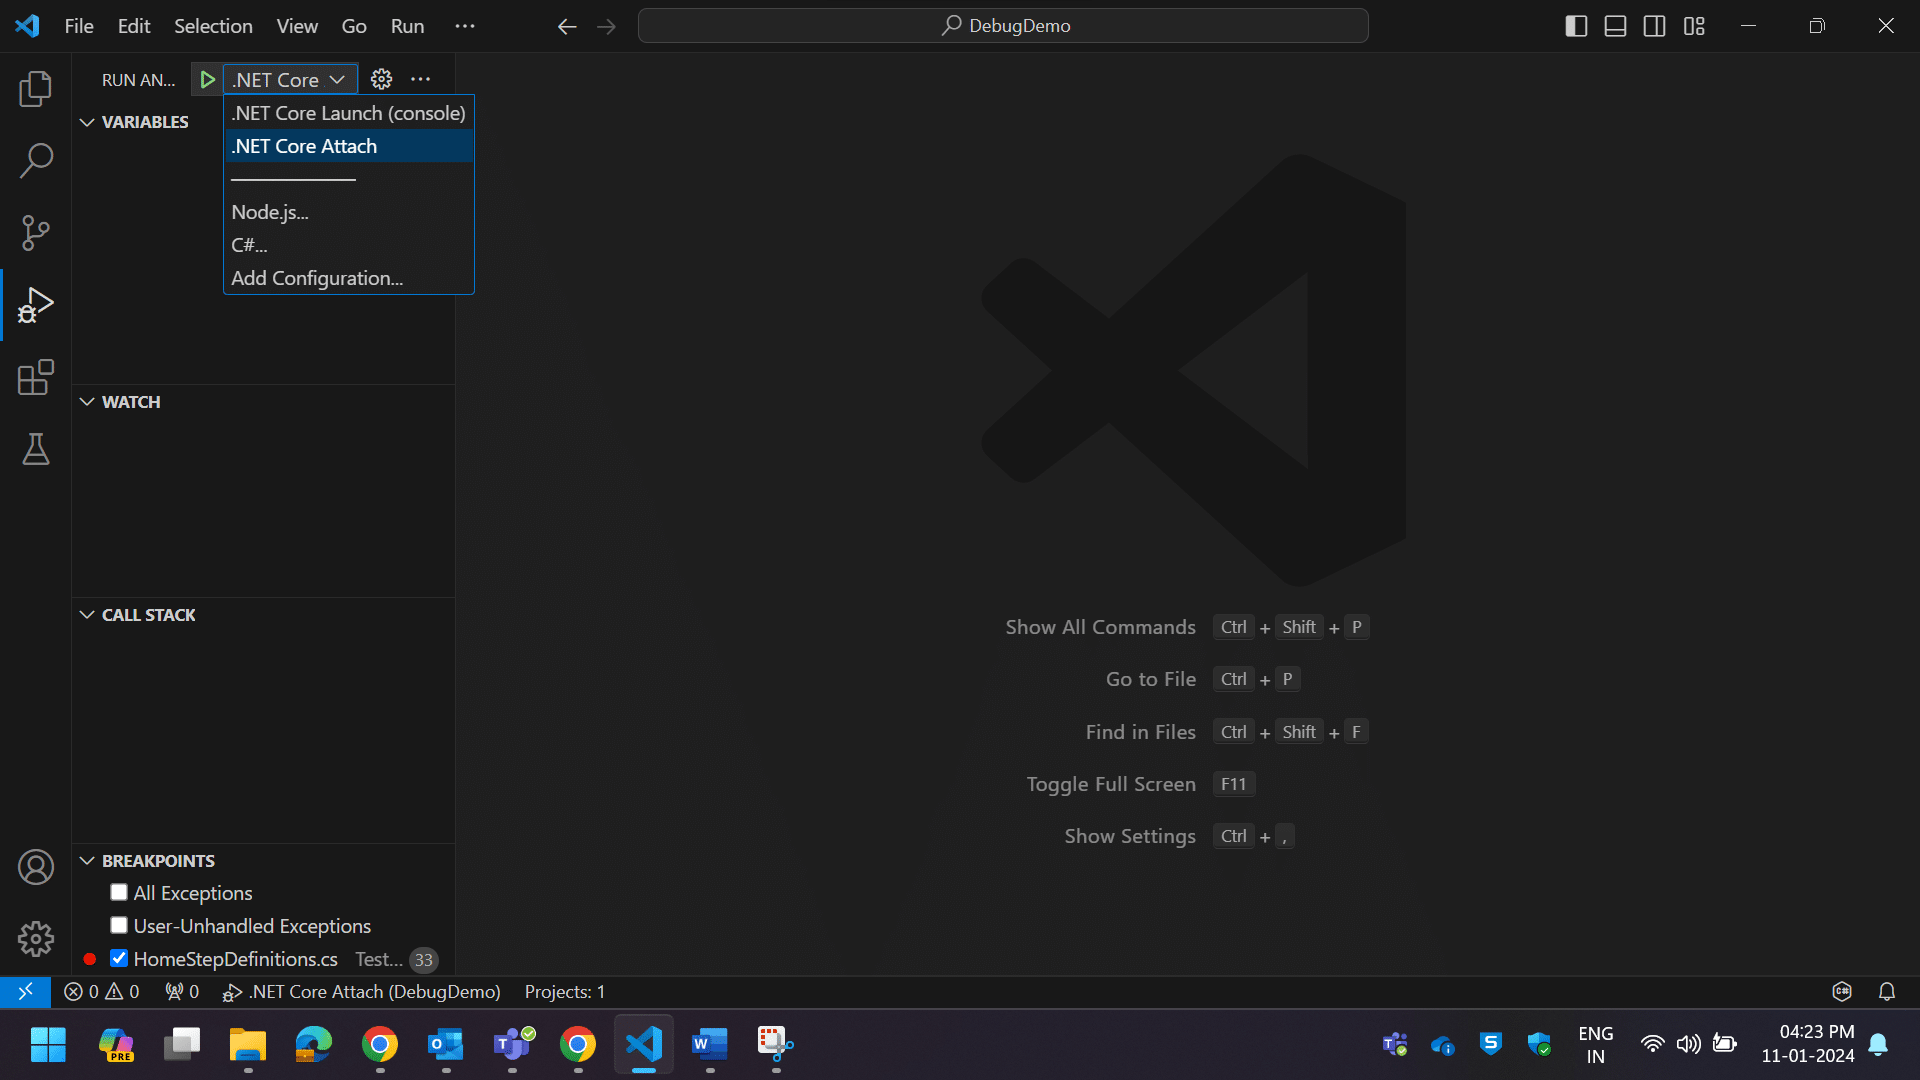
7) Select .NET Core Attach option from the dropdown menu.
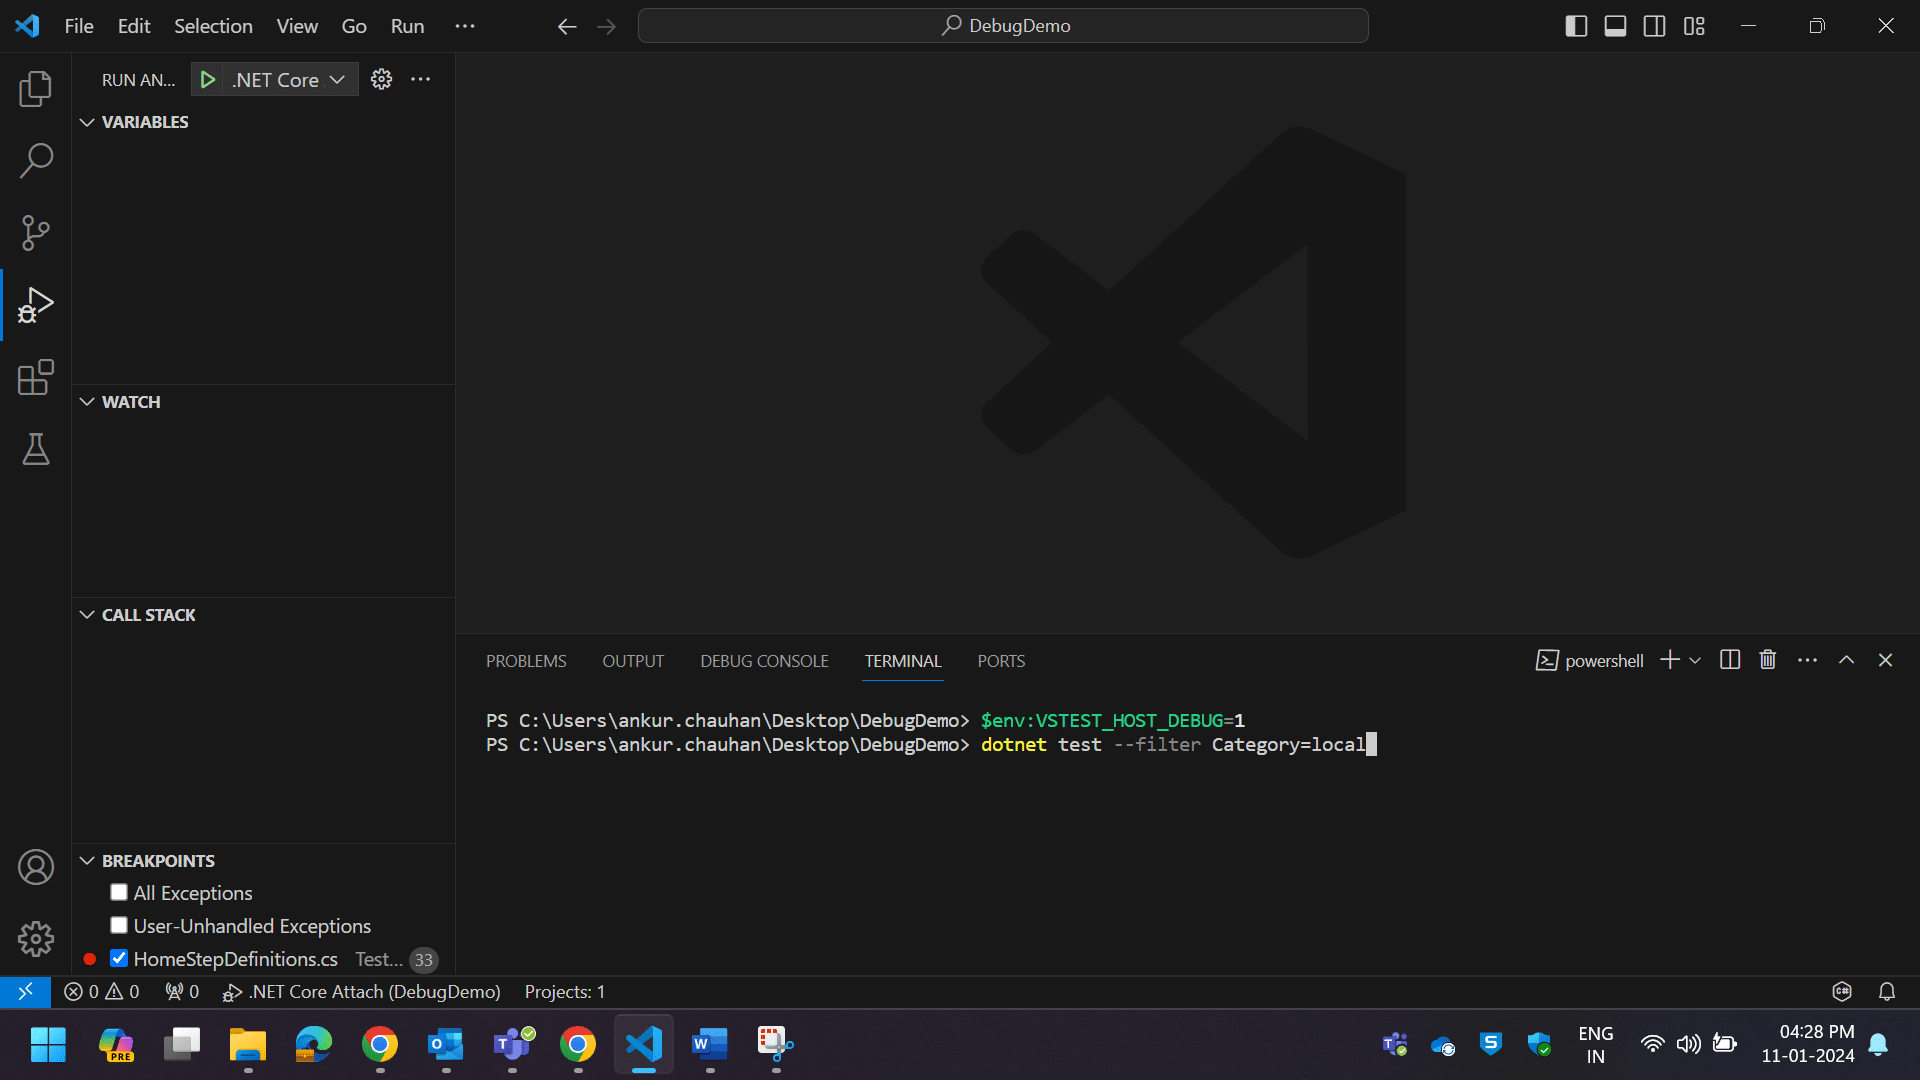
8) Open new Terminal & enter below into the terminal and hit Enter to set it up for debugging.
$env:VSTEST_HOST_DEBUG=1 – Windows
export VSTEST_HOST_DEBUG=1 – Mac
9) The terminal is ready for debugging, enter dotnet test followed by your project and press Enter.
If you have only one project in the solution, that project name is optional.
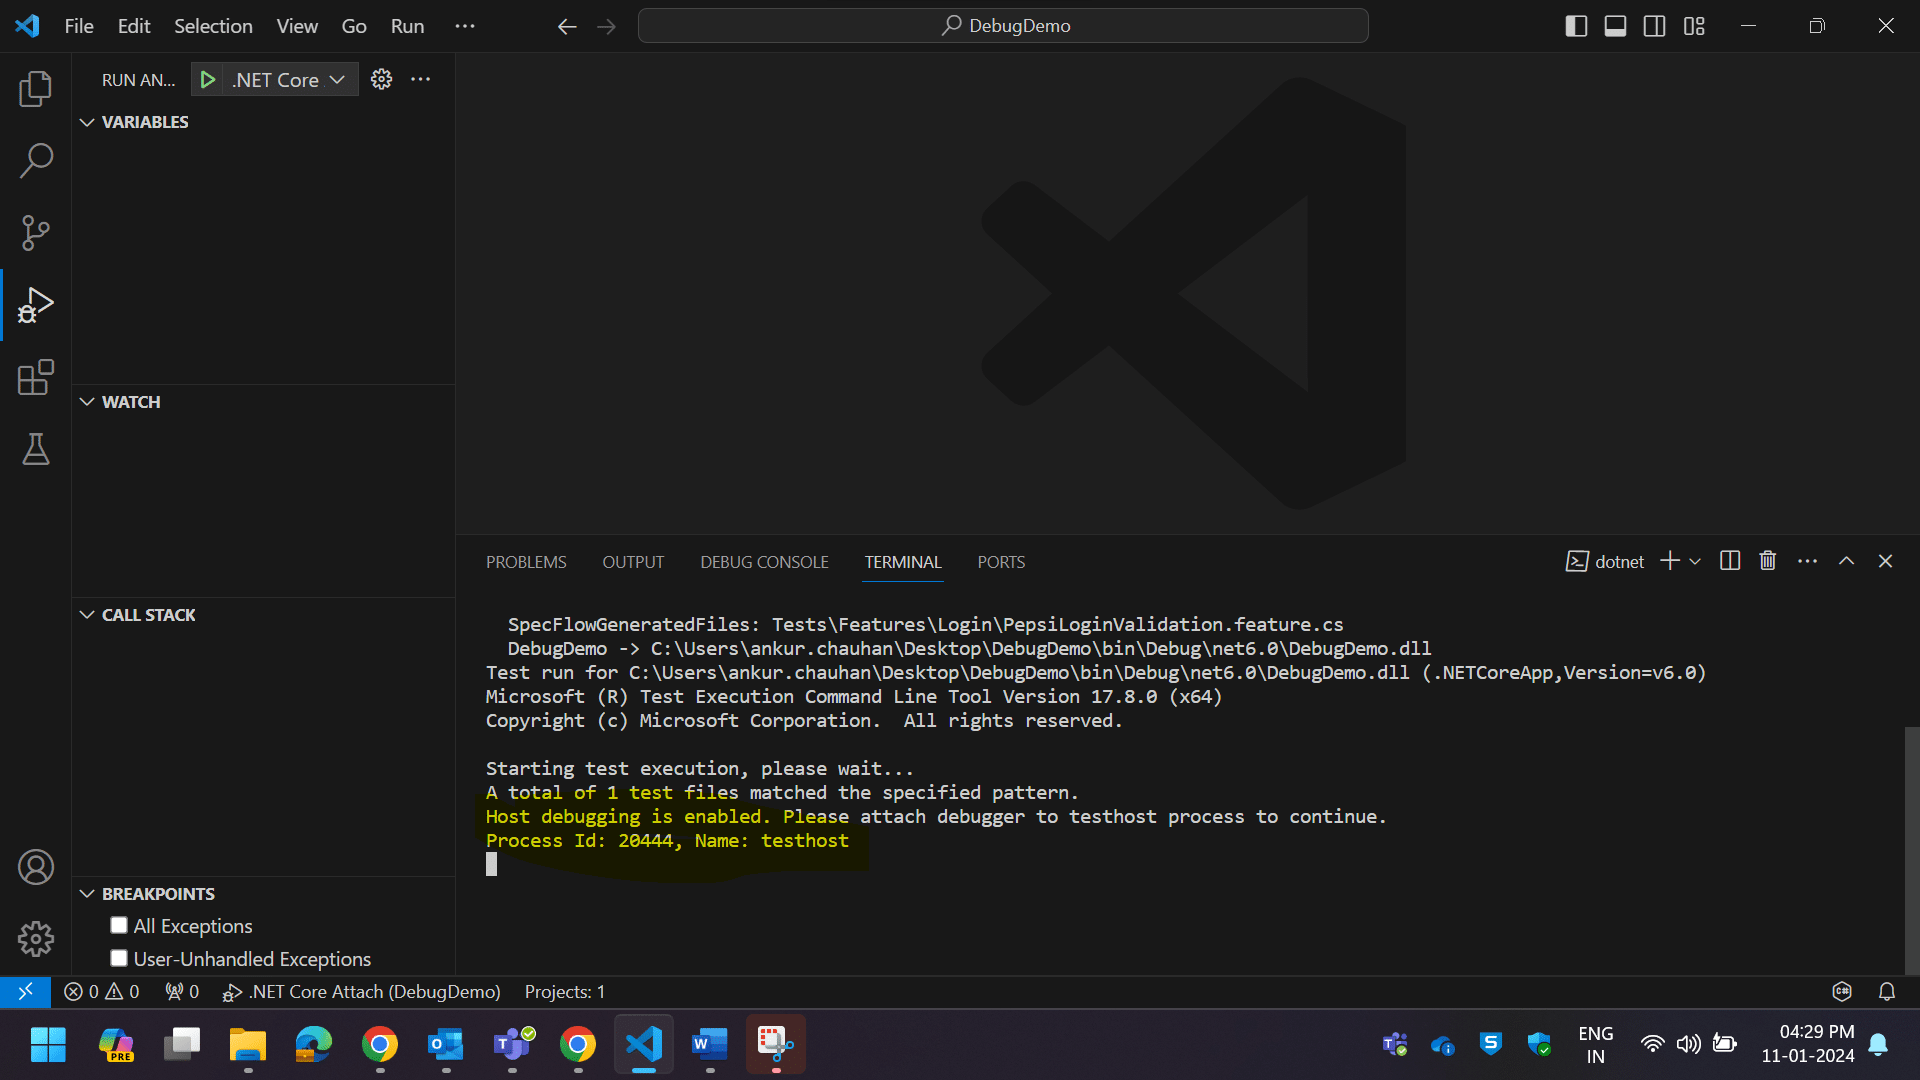
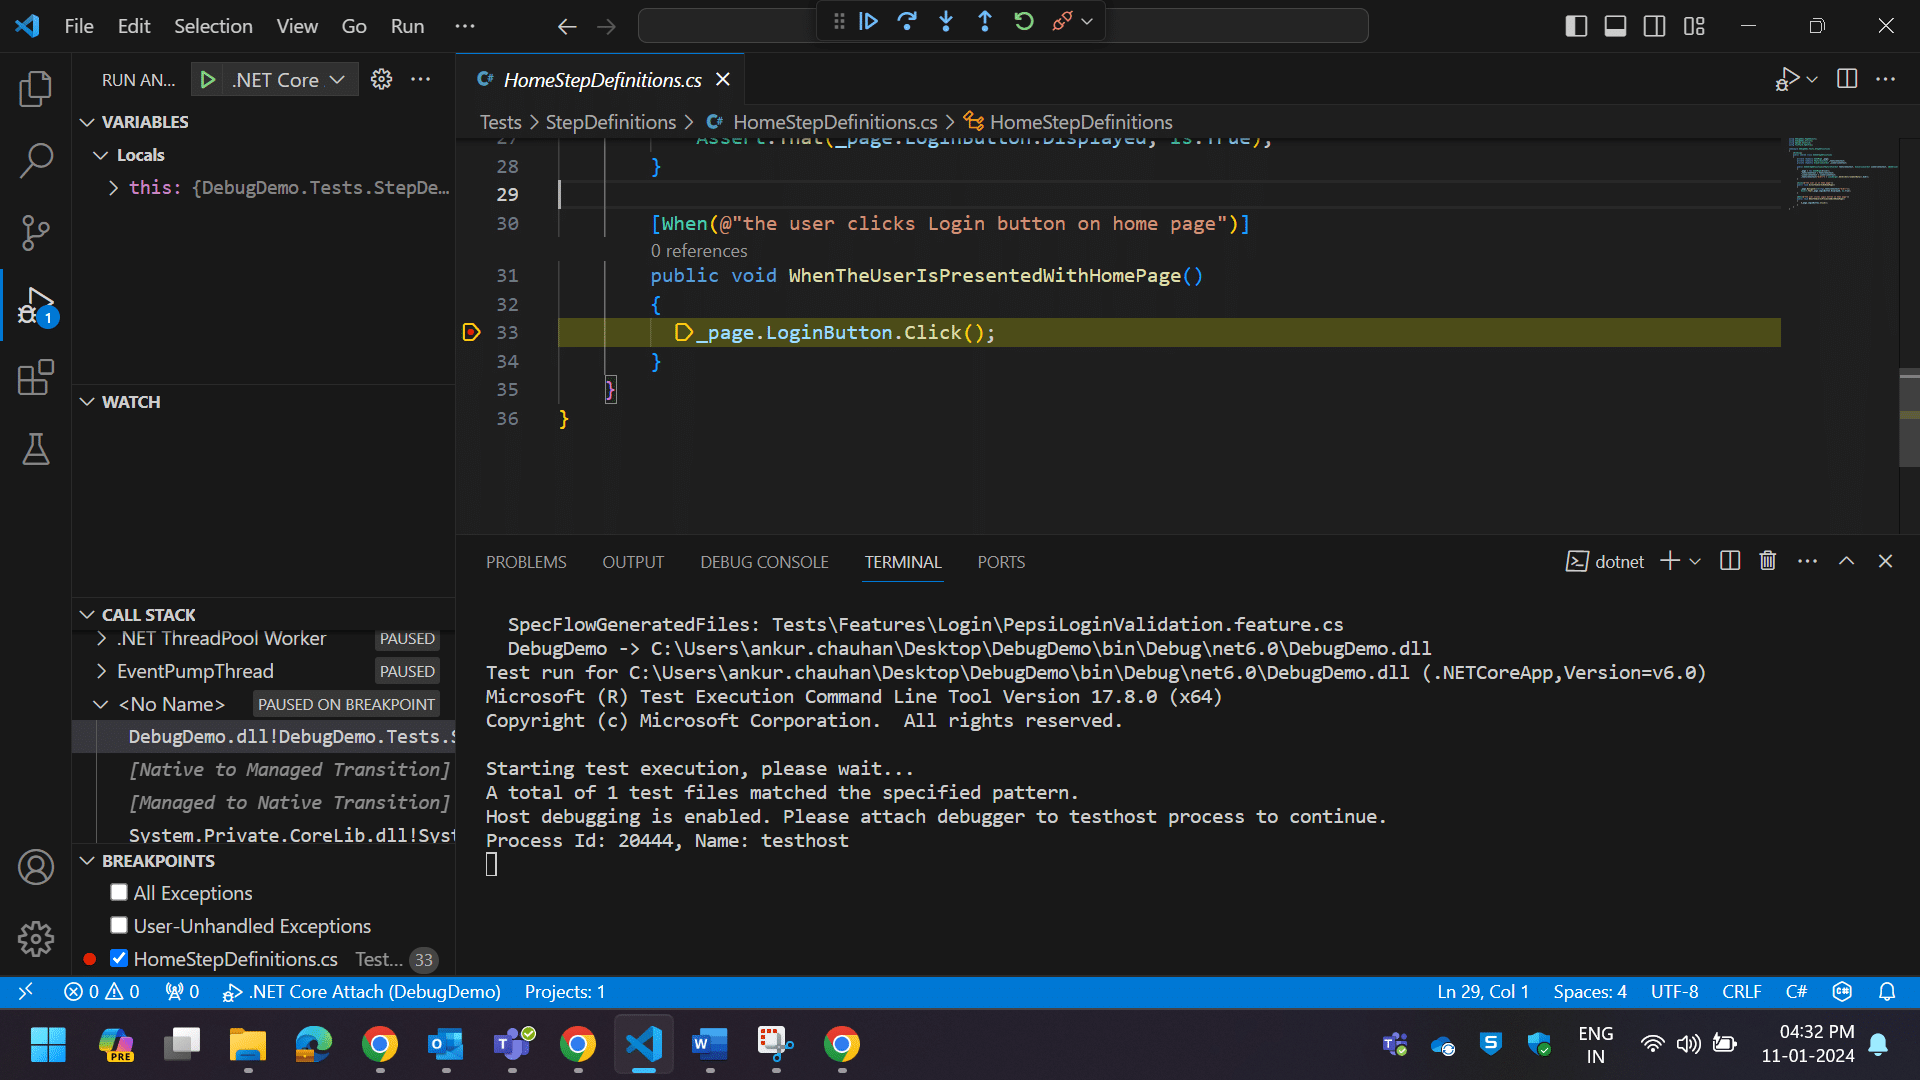
10) dotnet test command will then start in debug mode and display the test host process ID on which you can attach the debugger to. Copy the process ID number.
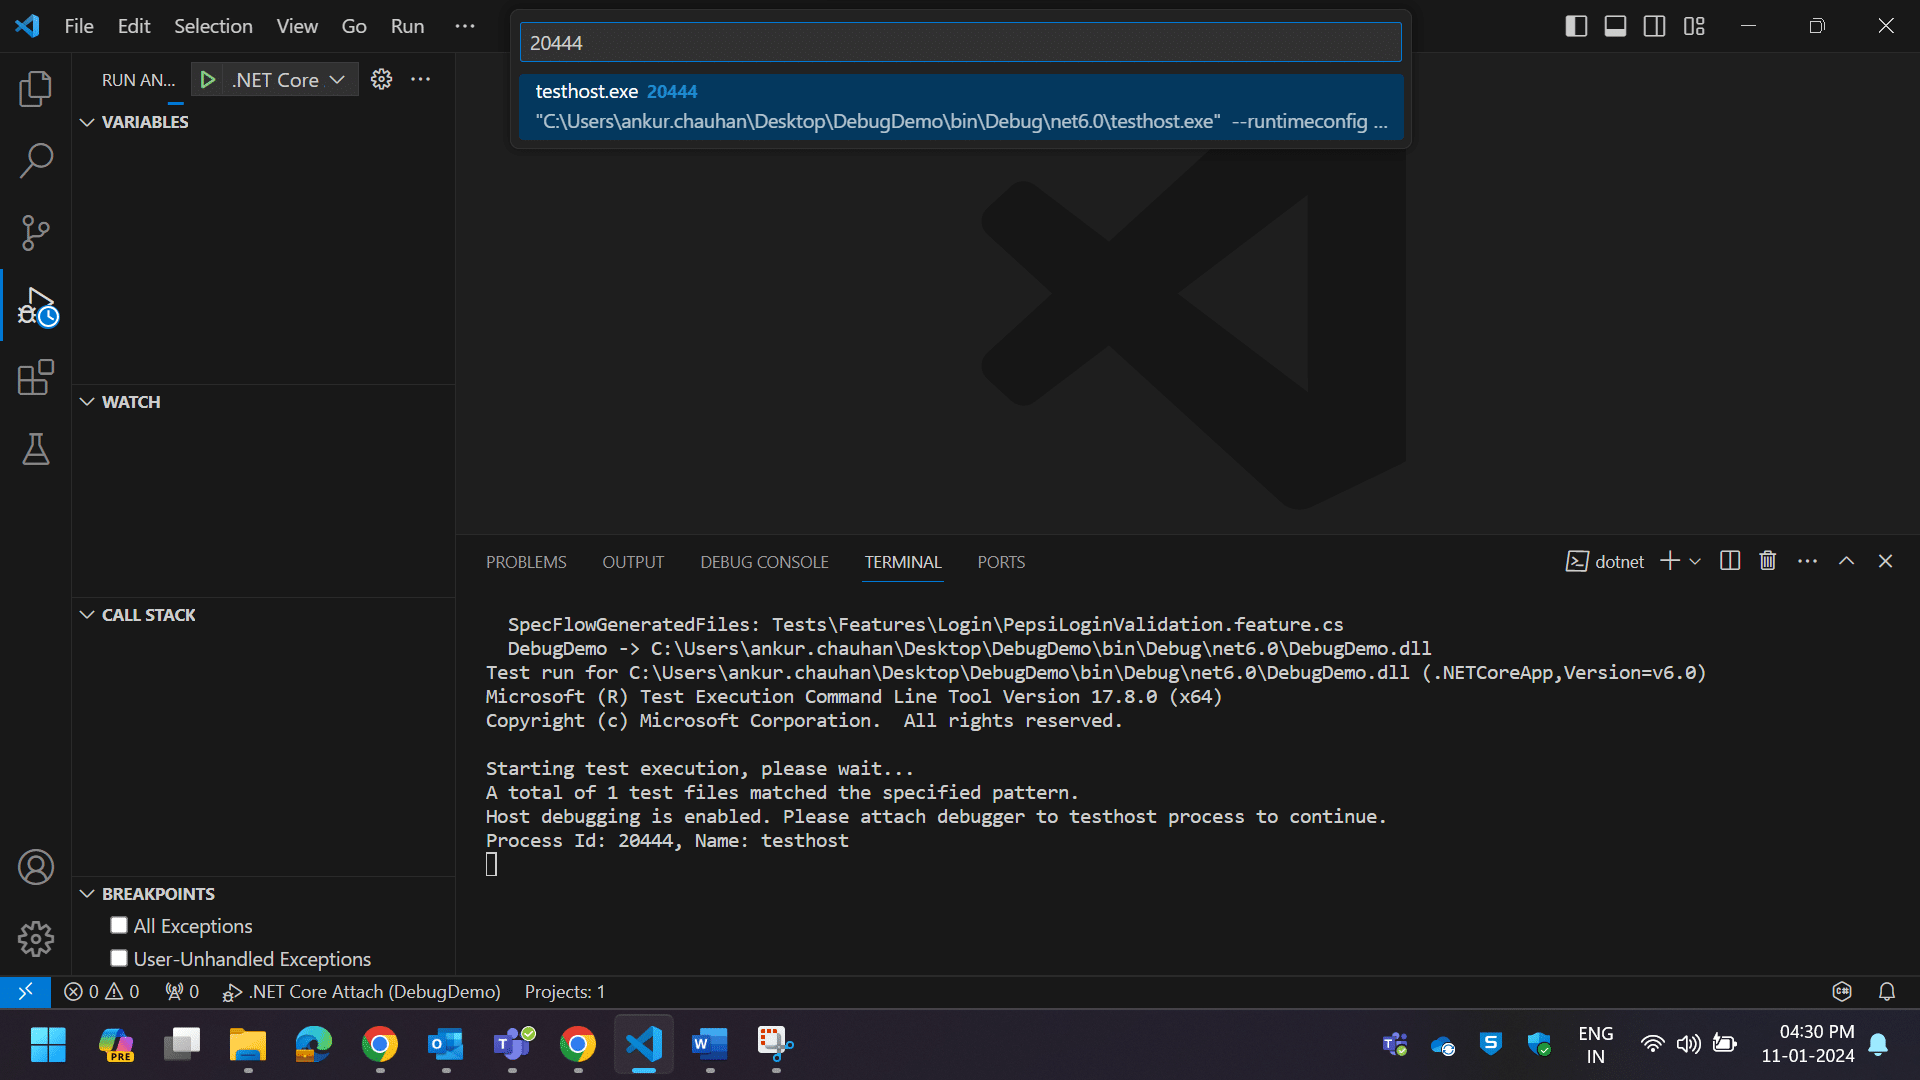
11) Navigate back to the debug menu on the left pane and then click on the ▶ icon which is present next to .NET Core Attach and paste the process ID number in the search box which you have copied in the previous step and select testhost.exe:
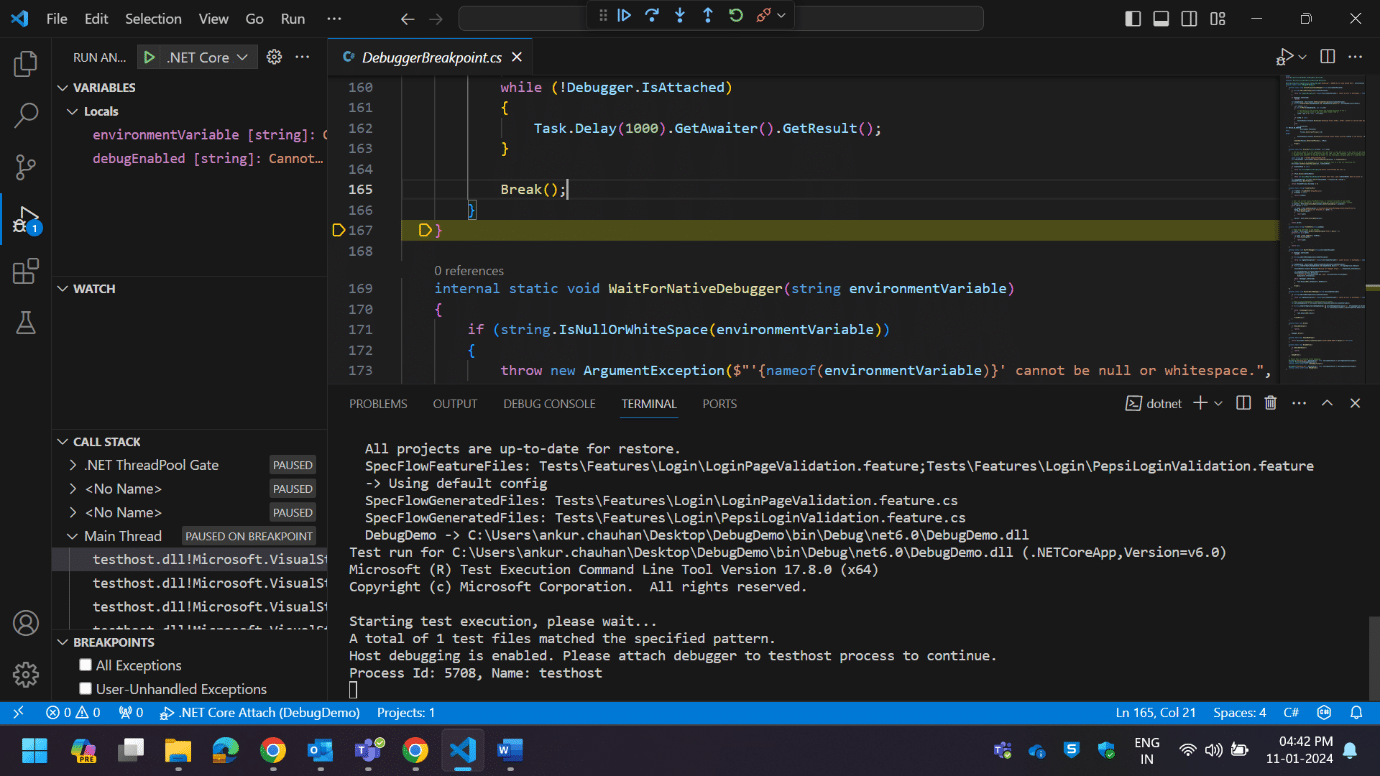
12) Once the debugger menu open and you can see additional debugging options:
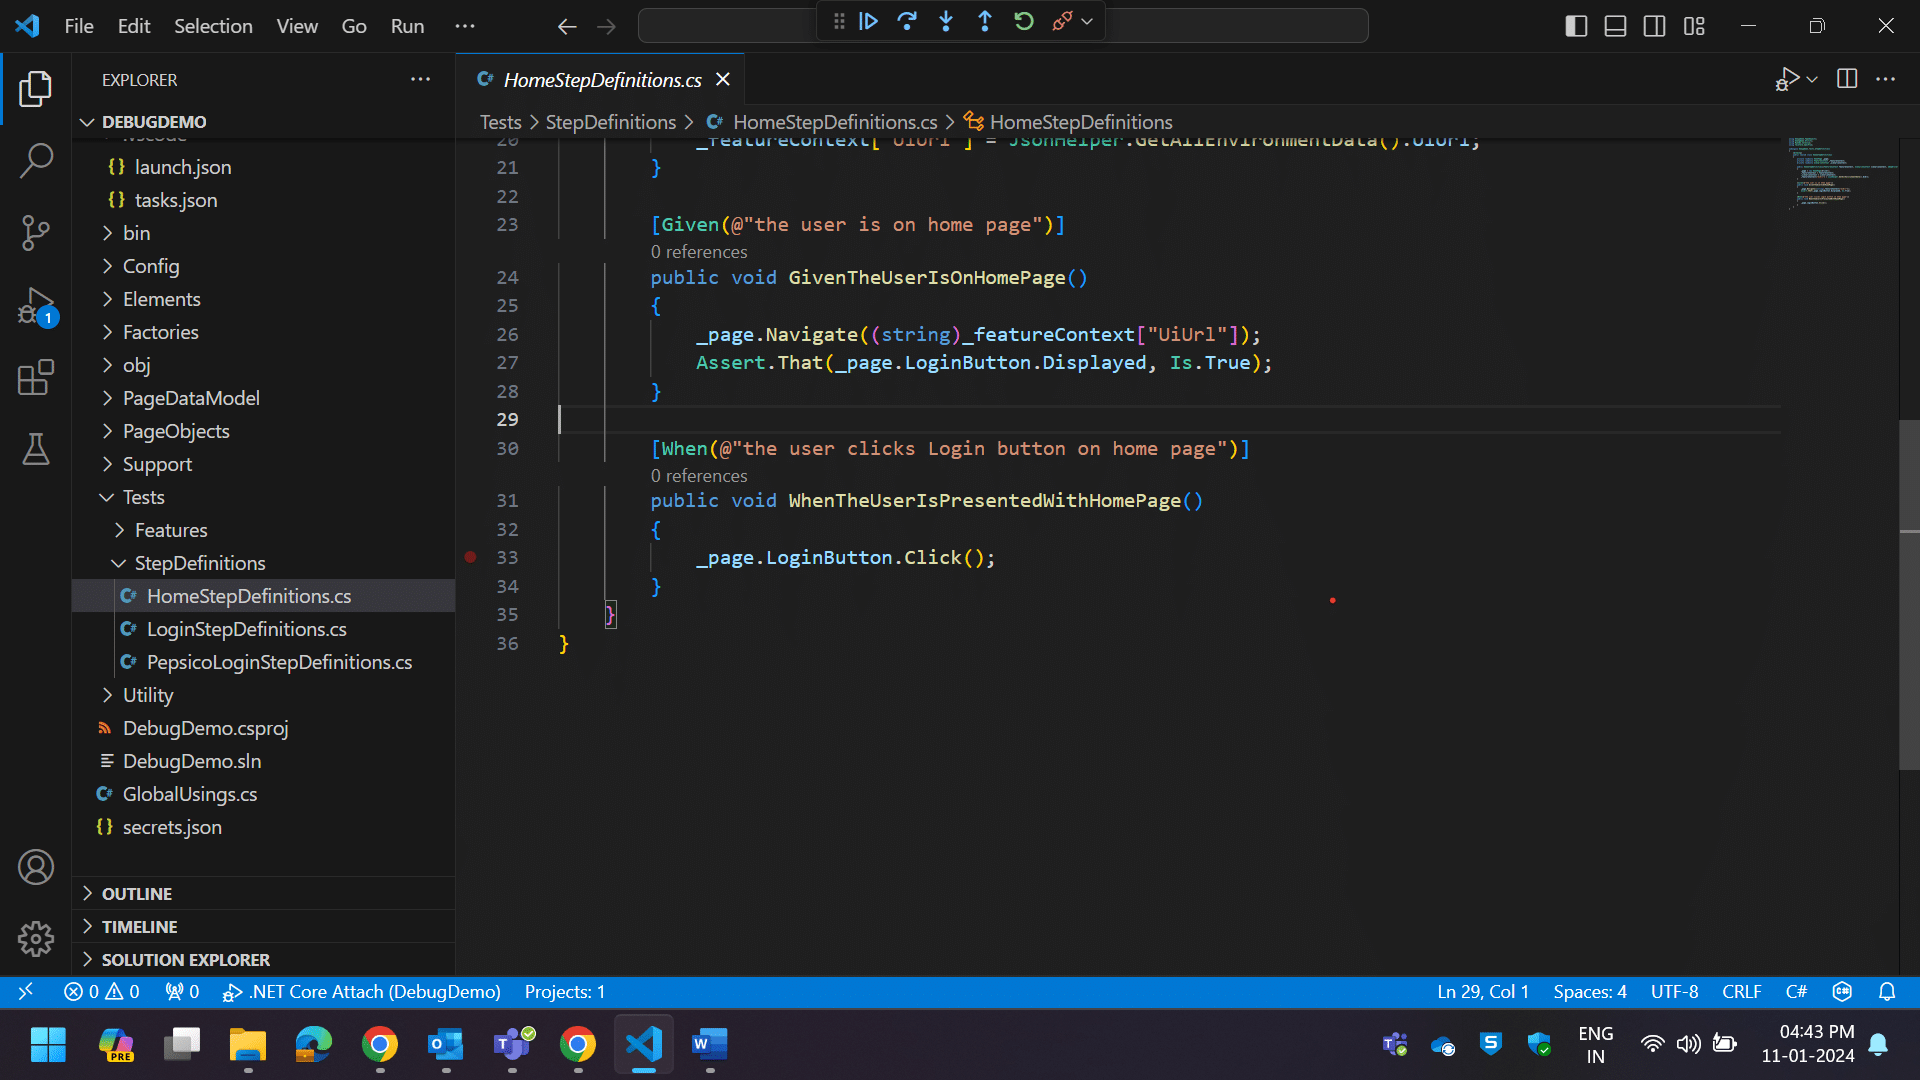
13) Now you can navigate to your files and set your break points before hitting the continue (F5) button at the top. You can create breakpoint before step 6 as well. The breakpoints will show on the left side Breakpoints panel.
14) The debugger menu buttons gives you options to navigate around & once finished you can disconnect by using the red unplug button:
15) When finished set the environment variable back to 0 to turn off debugging
$env:VSTEST_HOST_DEBUG=0 – Windows
export VSTEST_HOST_DEBUG=0 – Mac
Related Post:-