Pre-Requisites
- Java version -11: Make sure you have at least this minimum version
- Jmeter version – 5.4.3 only
- InfluxDB v2.0
- Grafana version – 8.2.
Setup of influxDb
- Download and install influx dB from here – https://dl.influxdata.com/influxdb/releases/influxdb2-client-2.3.0-windows-amd64.zip
- Expand the downloaded folder
- Open Command Line Arguments >>> Go to the path of influx dB

- Enter command – influx and >>> press enter
- Open the browser and hit the URL – http://localhost:8086/ >>> Now, you are able to access an influxDb UI successfully
Setup of Grafana
- Download and install Grafana from here – https://dl.grafana.com/enterprise/release/grafana-enterprise-8.5.5.windows-amd64.zip
- Expand the downloaded folder
- Go to the bin folder of downloaded grafana “C:\Users\HP\Downloads\grafana-8.5.3.windows-amd64\grafana-8.5.3\bin”
- Open grafana-server.exe from the bin folder
- Open the browser and hit the URL – http://localhost:3000/ >>> Now, you are able to access the grafana UI successfully
How to send the data from Jmeter to influxDB?
- Download the influxDb plugin jar
- Put “jmeter-plugin-influxdb2-listener-<version>.jar” to the <JmeterPath>/lib/ext folder
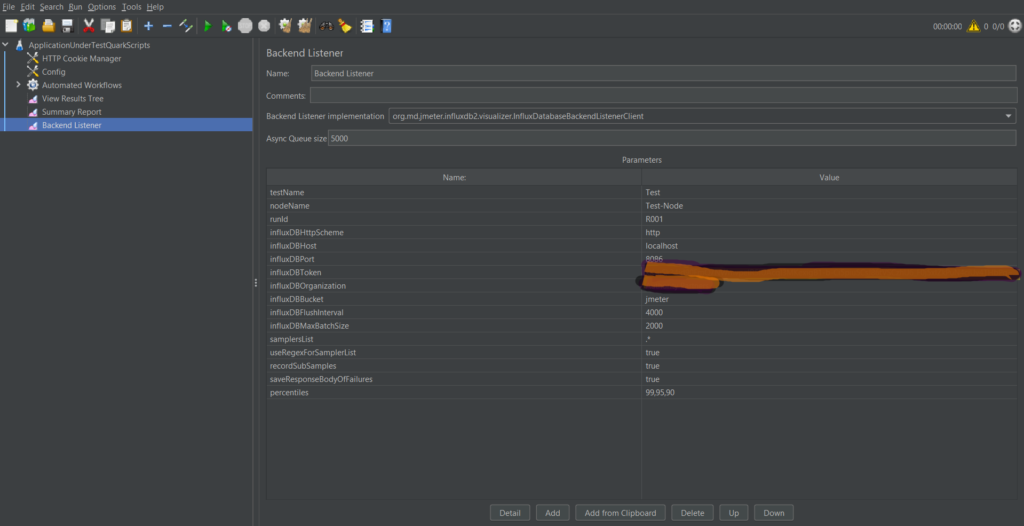
- Add Backend Listener
- Run Jmeter and select Test Plan >> Add >> Listener >> Backend Listener
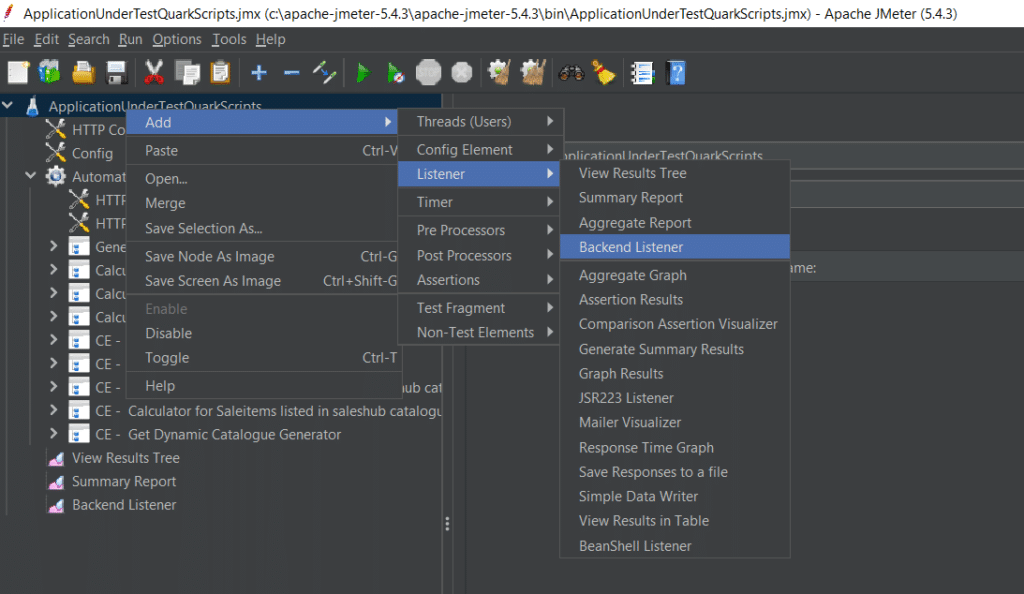
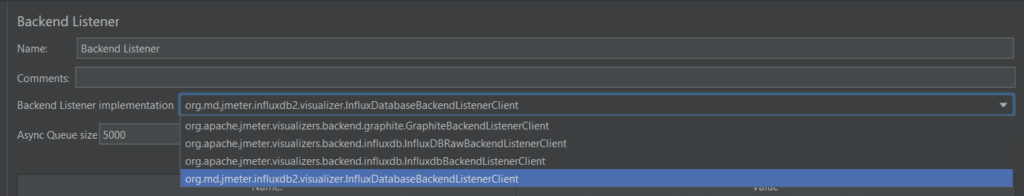
-
- Select “org.md.jmeter.influxdb2.visualizer.influxDatabaseBackendListenerClient” from the Backend Listener implementation dropdown
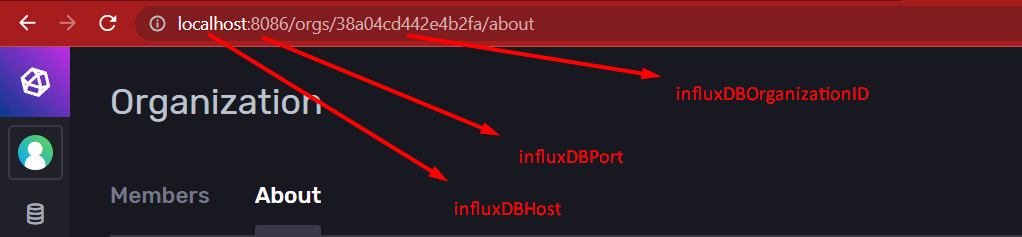
- Configure Backend Listener in JMeter by putting the following info-
- influxDBHttpSchema – http
- influxDBHost – localhost
- influxDBPort – 8086
- influxDBOrganization
- influxDBBucket
-
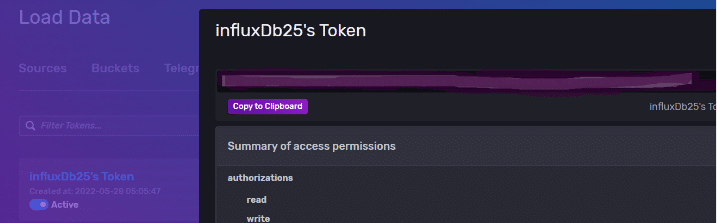
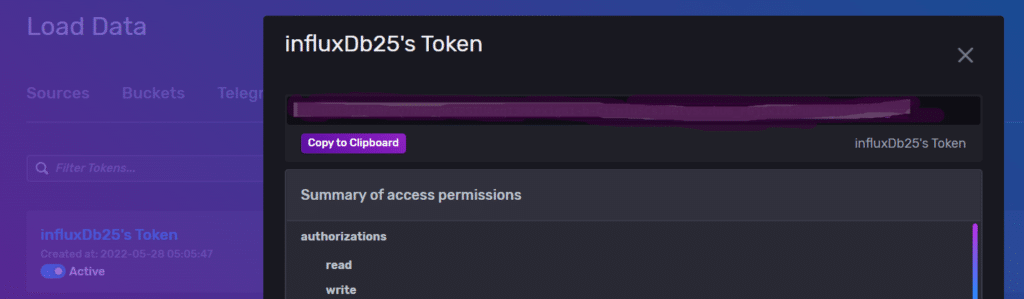
- influxDBToken – Put the token which you have generated in influxDB. You can copy it from here –
Configure influxDb
- Go to influxDb UI >> Data >> Bucket
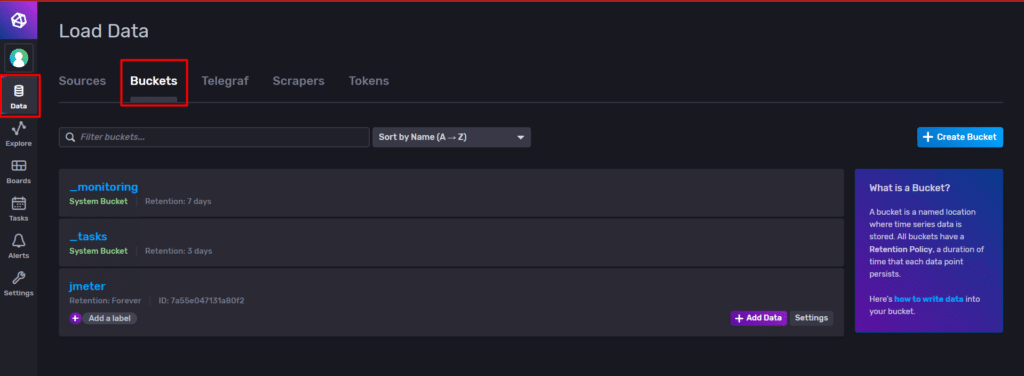
- Create a new bucket by clicking on the “Create Bucket” button displayed on the right
- Enter the name of the bucket which you want to create >> Create

2. Generate Access Token
- Access influxDb UI in browser >> Data >> Tokens
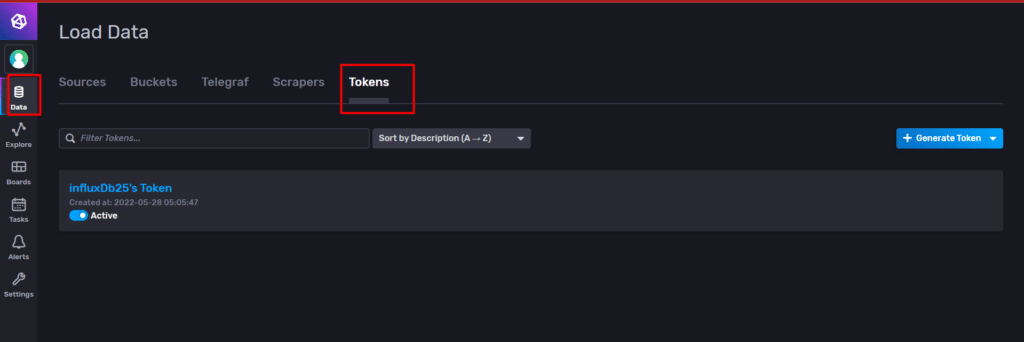
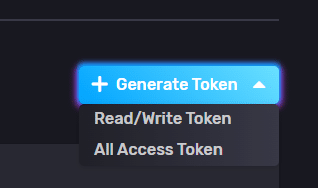
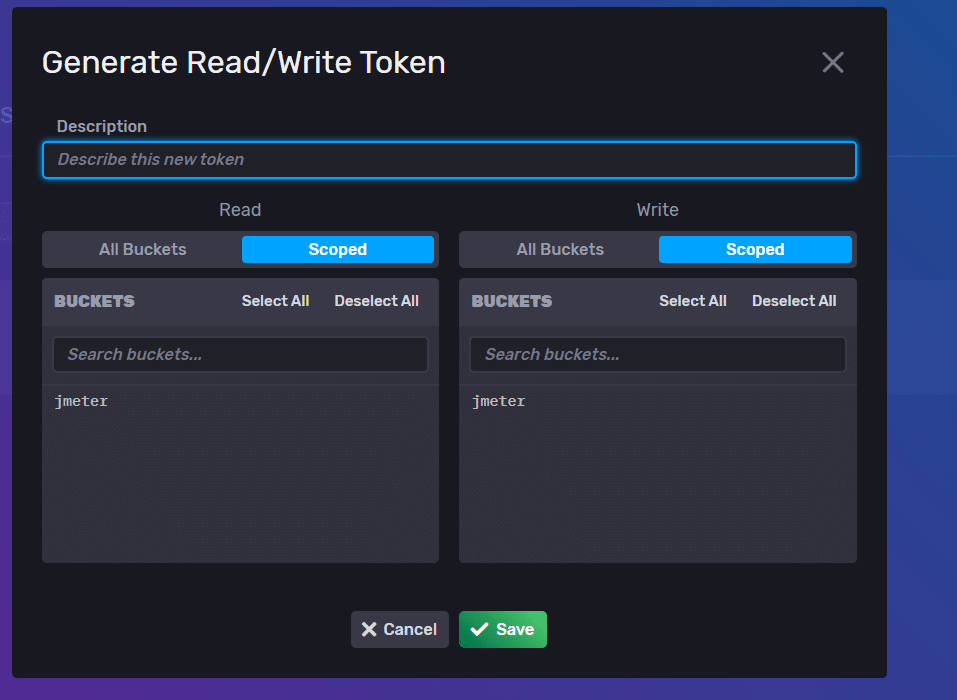
- Generate a new token by clicking on the “Generate Token” button displayed on right >> Opt “Read/Write” option from generate Token dropdown
- Enter the required information >>> Save
Configure influxDb As Data Source In Grafana
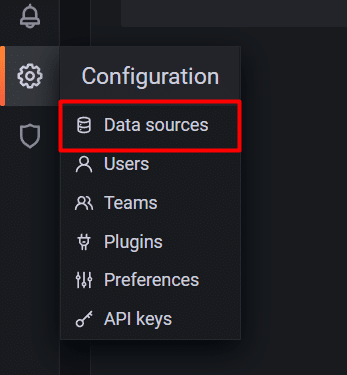
1. Access Grafana UI on browser >> Go to Configuration >> Data Source
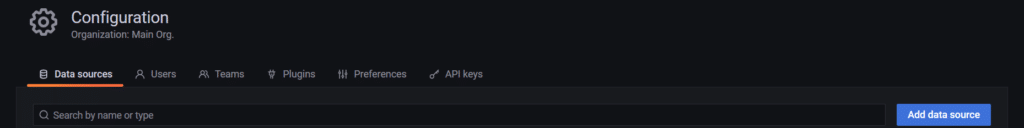
2. Click on the “Add Data Source” button displayed on the right side of the page
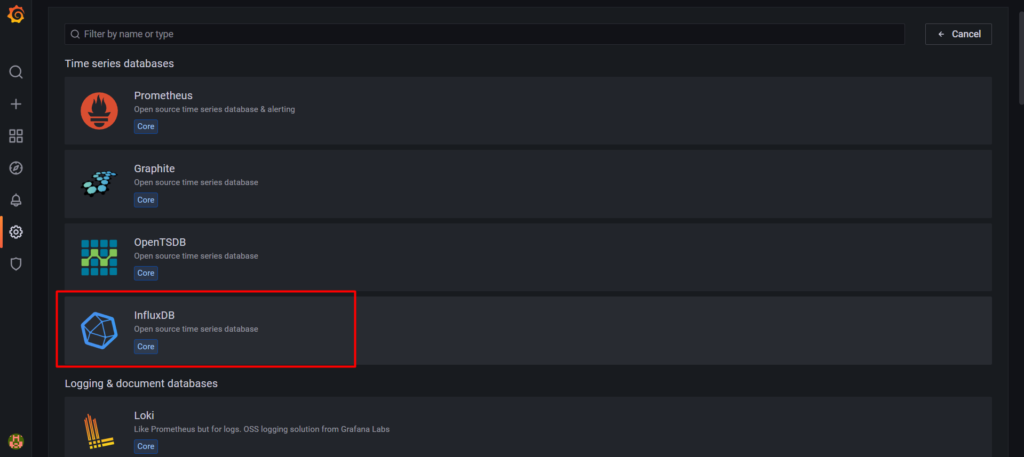
3. Select influxDB as a data source from the list
4. Put the following information while adding influxDB as a data source
- Name – Name of your data source. InfluxDB is selected as the default
- Query Language – Opt for any language from the dropdown in which you want to query
- HTTP
- URL – put the URL of your influxDB
- Access – Optional
- Allowed cookies – Optional
- Timeout – 300
- AUTH – select any authentication whatever you want
- Basic Auth Details – If you have selected “Basic Auth” in AUTH section then provide the following information
- User – Enter influxDb user name. You can copy it from here
-
- Password – Put the token which you have generated in influxDb, you can copy it from here
- Custom HTTP Header
- Header – Authorization
- Value – put the token which you have generated in influxDb
- InfluxDB Details
- Organization – Put the id of your organization from influxDB. You can copy it from the influxDb url

-
- Token – Put the token which you have generated in influxDb
- Default Bucket – admin
- Min time interval – 10s
- Max series – 1000
- After placing the above information >>> Click on the “Save & Test” button >>> Now, you can see the #number of buckets found post-integrated influxDB to Grafana

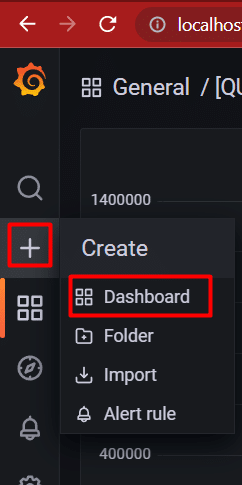
Create a Dashboard In Grafana Using Metrics
- Click on “+” icon displayed on left panel >> “Dashboard”
- Add Panel >>
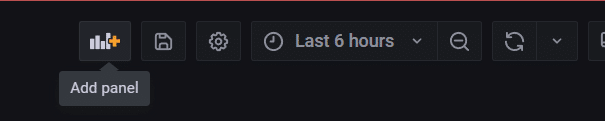
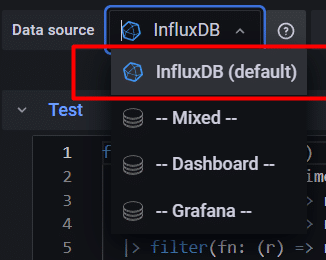
- Select the data source as “InfluxDB” from the dropdown
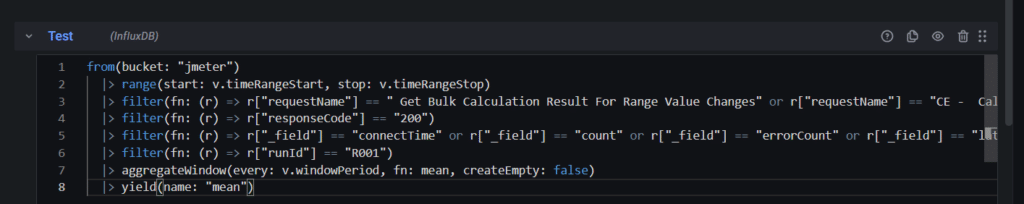
- Write queries
- Save your dashboard by clicking on the “Save” button
FAQs
- What is the element you need to use in JMeter for integration with InfluxDB?
We must tokenize to integrate with JMeter. Select Generate > Read/Write Token under Data > Tokens, as seen below. Click on Save after entering the description and choosing the bucket grafana integration with JMeter scope. To copy the created token, click on the token’s name.
- Is Grafana a monitoring tool?
Grafana is a well-liked visualization tool that is frequently combined with time series databases like InfluxDB, Prometheus, and Graphite, monitoring platforms like Sensu, Icinga, Checkmark, Zabbix, Netdata, and PRTG, SIEMs like Elasticsearch and Splunk, and other data sources in monitoring stacks.
- Can InfluxDB use with Grafana?
To visualize data from your InfluxDB Cloud instance, use Grafana or Grafana Cloud.
- How many threads can JMeter handle?
JMeter enables you to run numerous processes simultaneously and reliably creates up to 200 threads per JMeter instance.
- What is an influxdb listener?
A service input plugin called InfluxDB Listener watches for requests made using the InfluxDB HTTP API. The plugin’s purpose is to enable Telegraf to act as a proxy or router for the InfluxDB HTTP API’s /write endpoint. Note: Previously known as HTTP listener, this plugin.
- What is InfluxDB used for?
The company InfluxData created the open-source time series database (TSDB) known as InfluxDB. For the storing and retrieval of time series data in areas like operations monitoring, application metrics, Internet of Things sensor data, and real-time analytics, it is created in the Go programming language.
If you are interested in even more testing-related articles and information from us here at Devstringx, then we have a lot to choose from.