Introduction of Apache JMeter – Open Source Performance Testing Software
Apache JMeter is open-source testing software. JMeter is a 100% pure Java desktop application that uses for performance testing and analyzing the overall system performance under different loads.
It is user-friendly and can download for free of cost. JMeter was originally used for testing Web Applications or FTP applications. Today, its uses for functional tests, database server tests, etc.
Many protocols that are supported by Apache JMeter
- HTTP, HTTPS sites
- Web Services
- Database via JDBC drivers
- Directory – LDAP
- JMS (Java Message Service)
- SMTP( Simple Mail Transfer Protocol)
- FTP Services( File Transfer Protocol)
JMeter Advantage
- Open source license
- Friendly user interface
- Record and playback feature
- Easy installation
- Multi-threading framework
- Multiple protocols supported
Basic Components of JMeter
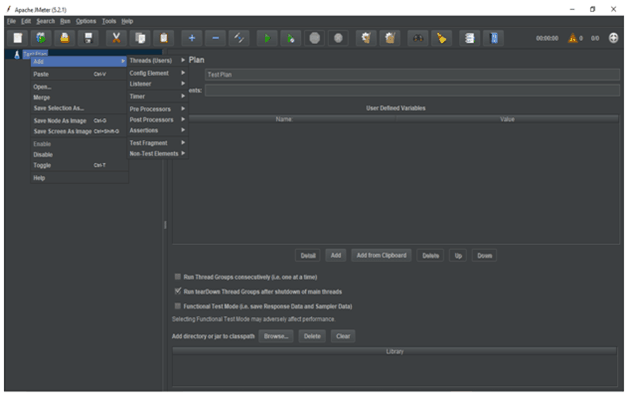
1) Test Plan
It is a root feature in the JMeter tool where all the settings are described/mentioned for executing a test. It describes all the steps that JMeter has to execute when tests are run. A test plan consists of Thread Group, Timers, Config Elements, Listener, Assertion, pre/post processors, etc. JMeter offers various customization as it can be used depending upon the user’s requirement.
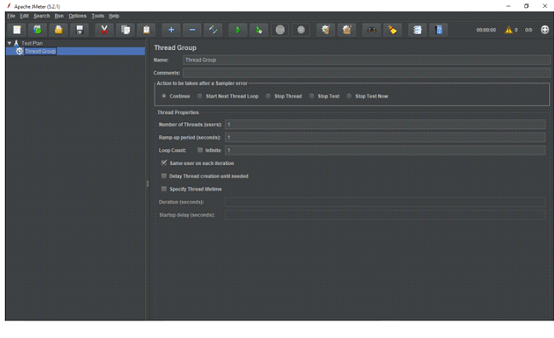
2) Thread Group
Thread Groups can be defined as a collection of Threads. Each thread represents one user using the application under test.
Basically, each and every thread simulates one real user request to the server. The thread group elements are responsible for handling the number of threads. We can manage the following things by using thread groups:
- Number of threads to run
- Ramp up time (period of time in seconds, that tells JMeter how long it takes to start all the threads)
- Number of iterations (Loop count)
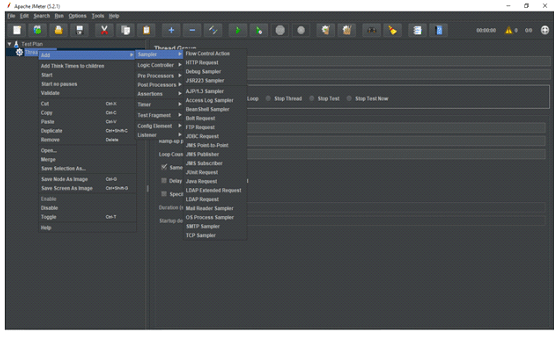
3) Sampler
Now, we already know that Thread Groups simulate user requests to the server
But how will a Thread Group understand which type of requests (HTTP, FTP, etc.) it needs to make?
The answer is Samplers
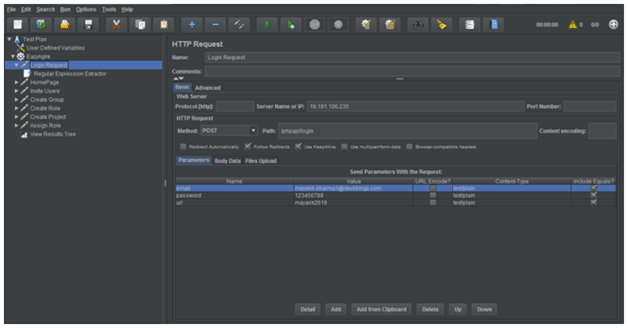
The sampler is responsible for sending a specific type of request to the server. For instance, we can have an HTTP Request Sampler if we need to perform different operations like POST, GET, and DELETE on HTTP services or web applications.
JMeter has a different type of sampler. HTTP Request Sampler is the sampler used for testing web applications. Samplers do the actual work for JMeter and are responsible for generating one or more sample results. Some majorly used samplers are listed below:
- HTTP Request
- FTP Request
- JDBC Request
- Java Request
- SOAP/XML Request
- SMTP Sampler
- BSF Sampler
- Debug Sampler
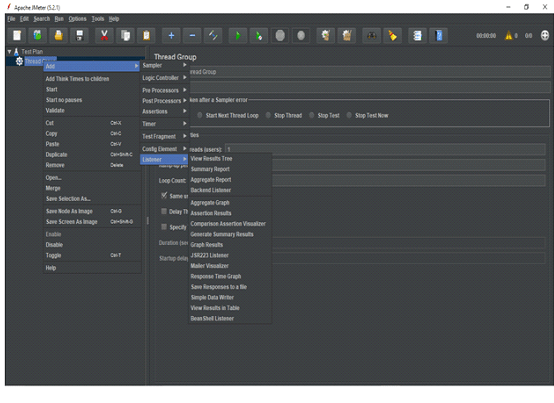
4) Listeners
The listener records the results generated by the samplers. Listeners show the results of the test execution. The result can be shown in a different format such as a tree, table, graph, or log file.
Listeners also provide the different response time matrices (average time, minimum time, max time, etc) of a Sampler request. Also, If there are a lot of samplers in a thread group, then the listener may consume a lot of memory.
Read Also:- TestNg Listeners In Selenium Tests
Some listeners provided by Apache JMeter are:
- View Results in Table
- Graph Results
- Assertion Results
- View Results Tree
- Aggregate Report
- Mailer Visualizer
- Simple Data Writer
- Aggregate Graph
- Bean Shell Listener
- Summary Report
5) Assertion
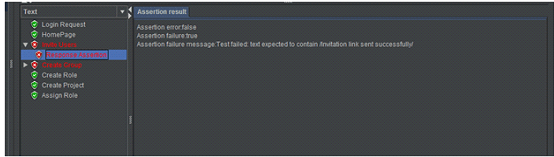
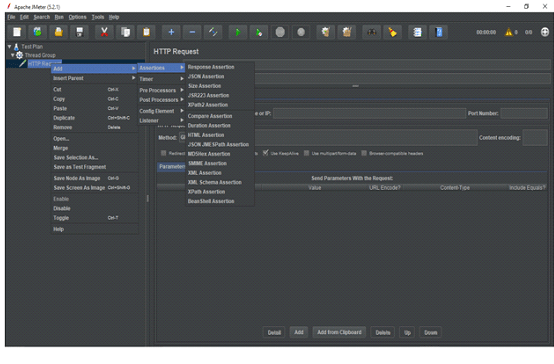
The assertion in JMeter is responsible for validating the response of the request that users have sent to the server. It is a process where you verify the expected result with the actual result of the request at run time. If you need to apply assertion on a particular Sampler, then users have to add it as a child of that Sampler.
Assertion results can view by adding “Assertion Listener” to the Thread Group. If an assertion gets fails, the sampler request mark as fails and the same gets reflects in the test results listeners.
Some Assertion listeners provided by JMeter are:
- Bean Shell Assertion
- BSF Assertion
- Compare Assertion
- Duration Assertion
- HTML Assertion
- Response Assertion
- Size Assertion
- SMIME Assertion
- XML Assertion
- XML Schema Assertion
- XPath Assertion
How to add Assertion:
Simply, Right Click on a Sampler Request -> Hover over Add -> Hover Over the desired Assertion -> Click on the required Assertion
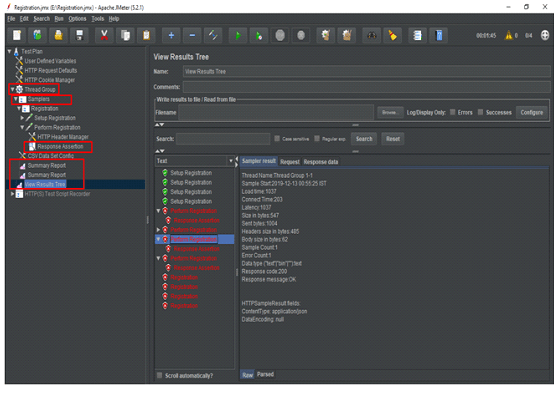
Running Test Plan
Once the sampler(s) are ready, we can add a couple of reporting elements(Listeners) to gather statistics at runtime, and start the load test.
In the screenshot below, while our test is running, we can monitor the following things
- Test Plan
- Thread Group
- Samplers – Registration
- Assertion – Response Assertion
- Listeners – View Result Tree, Summary Report